
Understanding EKG: Basic Rhythm Variations and Graph Paper Explained
Electrocardiograms, or EKGs, are essential tools for monitoring heart activity, providing crucial information about a patient’s cardiac health. The YouTube channel Teaching Trends has released an insightful video, perfect for anyone stepping into the world of cardiac monitoring.
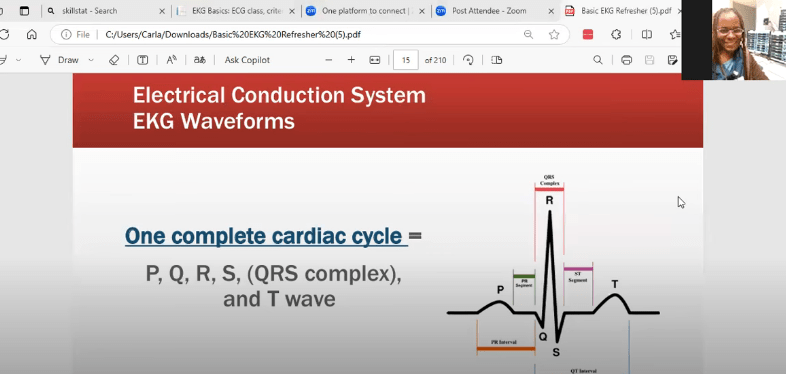
Breaking Down the EKG Waveform
The video explains how EKG waveforms appear on monitors or graph paper, each component offering a glimpse into heart activity. These waveforms help identify whether a heart rhythm is normal (sinus rhythm) or abnormal (dysrhythmia).
Key components of an EKG include:
- P Wave: Represents atrial depolarization, usually an upward deflection.
- PR Interval and PR Segment: Reflects the time between atrial and ventricular activation.
- QRS Complex: Indicates ventricular depolarization — starting with a small negative deflection (Q wave), a large positive deflection (R wave), and a final negative deflection (S wave).
- QT Interval and ST Segment: Show the heart’s recovery phase, with the T wave representing ventricular repolarization.

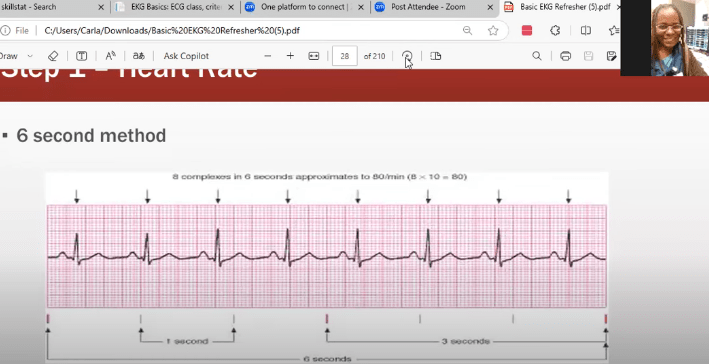
Why Graph Paper Matters
EKG graph paper plays a vital role in accurate analysis. Each small square typically represents 0.04 seconds, helping measure intervals and detect abnormalities like prolonged QT intervals or irregular rhythms.
Whether you’re a medical student or healthcare professional, this video simplifies complex concepts, ensuring you grasp the essentials of EKG interpretation.


